
 Official data gathering is not keeping pace with fragmented work. But “40% of US workers by end 2025” is now a defensible estimate..
.
It’s all in the definition
Before Covid, you may have seen estimates putting “gig work” at anything from 2% to 40% of employment. How so? Studies of non-standard employment tend to probe a particular aspect of the trend. To take one example of confusion that often results: In February 2018 US Labor Secretary Alexander Acosta told reporters new contingent labor data showed substantial growth in gig work that would “force a national debate“.
 But his department’s final figures said on-demand work had fallen to 1.7%. However, that dataset counted only primary employment and excluded “electronically intermediated” work, independent contractors, and shadow working.
We suggest a definition based on lifestyle. Look at: “paid work, outside-the-home, with no right to regularity”. That excludes high-skilled individuals able to work at home as they like.
We suggest a focus on anyone who has to be in a specific place at a given time for periods of unpredictable work. We include; individuals working off-the-books, W-2 taxpayers with a primary employer but ever-changing hours, platform workers, people intermediated by agencies, the self-employed, those whose entire income derives from unstable work and people who use it to supplement a steady – but inadequate – income.
Why do official data undercount irregularity?
Bureau of Labor Statistics has at times suggested ad-hoc employment is marginal. A drumbeat of diverse reporting suggests that might not be the an accurate assessment:
- “We’re doing a terrible job of measuring the modern workforce, and the feds know it” (Washington Post; Oct. 9, 2015)
- “Where are all the Uber drivers? Not in these government statistics” (Los Angeles Times; Jul. 27, 2018)
- “The Government has no Idea How Many Gig Workers There Are” (Morningstar; Aug. 5, 2018)
- “We’re Measuring the Economy All Wrong” (New York Times; Sep. 14, 2018)
- “Unreliable data is complicating the unemployment crisis” (Axios; Sep. 4, 2020)
Why is official data detached from fragmenting employment? We see three reasons:
- Changing nature of a job: Sources used by Bureau of Labor Statistics tend to measure employment instances: someone starting work for an organization. But someone doing three periods of gig work for different employers this week can create three instances of new employment. It doesn’t mean a trio of jobs were created.
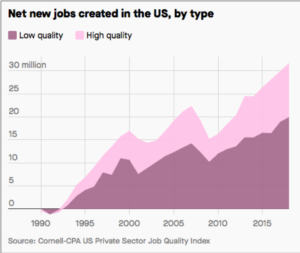 Even where there is an on-going employer/ employee relationship, it may not be predicated on regular hours or pay. The Job Quality Index shows how many of today’s “jobs” can in reality just be irregular work for one employer. This trend was developing fast even pre-pandemic. Official data collection is not configured to pick up the nuances of today’s employment.
- The shadow/ gray/ informal/ underground economy: Official datasets and polling typically ignore invisible, cash-under-the-table working. But it’s an enormous factor in irregular employment. It’s so easy to ask round local households or small businesses for a few hours’ work with cash at the end.
Economic activity that would be legal if taxed and regulated was totalling 10-12% the size of GDP in the US in the 2010’s according to World Bank researchers. There’s some home working in those figures. But breakdowns show the majority is out-of-home work.
 Prevalence of “side hustles”: Bureau of Labor Statistics was not set up to count a population doing odd hours here and there even when seemingly in full time employment. But multiple studies show work on-demand and other ad-hoc earning opportunities becoming the new norm in many households.
.
Numbers are fuzzy, but big
 Taking a broad definition, how many work irregularly? There was a general 2019 consensus around 35% of the workforce. That includes at-home freelancing. But it generally excludes off-the-books employment which is almost entirely irregular.
Multiple reports contributed to that consensus:
- In 2018 the Federal Reserve found 31% of adults did gig work each month. And Gallup concluded “36% of American workers have a gig work arrangement in some capacity“.
- In early 2020, 35% of job-holders were involuntary part-time, needing more hours. 84% experienced timing changes to their hours of work with less than 48 hours’ notice.
- 24% of Americans have earned through online “gig” platforms.
.Some other attention-grabbing findings from the last five years:
- Nearly all net jobs growth since 2005 is explained by rising gig work.
- 52% of America’s workers want about 20% more work (Table A-1 at end of report).
- Around 40% of American workers were forecast to be in non-standard employment, with self-employment tripling over two years, by 2020.
- As formal labor market participation fell, local shadow economies grew, even doubled. Estimates of Americans earning off the books seemed to settle between 25% (finder.com) and up to 40% (Urban Institute).
How do these numbers map onto the three cohorts of irregulars? We estimate in 2021, 20% of the workforce were core irregulars, 10% voluntary and 20% found themselves forced into irregularity; these estimates are all defensible with independent research.
The inadequacy of data on irregular employment is becoming a profound problem. (It would be solved by better markets for this labor.) But given the pre-pandemic trajectory, it’s not difficult to see 40% of American workers reliant on at least some gig work by December 2025.
How can we size irregular employment in our area?
It’s hard. Possibilities include:
- NACO’s county-by-county breakdown of non-employer businesses in the legitimate economy.
- BLS count of numbers of people with multiple jobs by state.
- Layering area demographics on BLS figures for under-employment.
 There is data on gig work in your region held by app companies. But they are not noted for transparency, or even honesty. Unless some factor makes your area an outlier, you will likely arrive at 30-40% as the proportion of employment that is irregular.
We suggest a more insightful question than “exactly how big is this?” is asking “What leverage do we have locally that could influence conditions in this part of our labor market?” That requires convenings and interviews. They could be structured around a specific aim, like launching a new market for this labor. Or smaller interventions could be tested. It’s all covered in our implementation section.